



Economic & Market Summary Q3 2026
____________________________________________________________________
Market Summary September 30, 2026
___________________________________________________________________________________________
 Stock Market
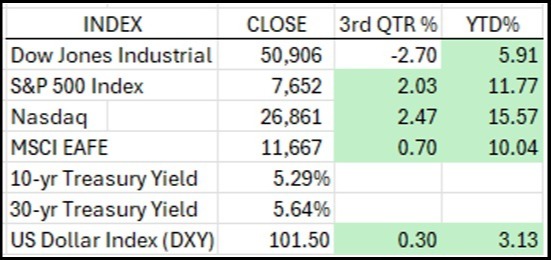
Both the U.S. and International Developed Markets posted modest gains for the 3rd quarter. The Dow Jones Industrial Average (DJIA) and the S&P 500 briefly reached new all-time highs in August before pulling back as renewed tensions in the Middle East drove oil prices higher and lifted market volatility. Rising oil prices, elevated inflation and higher interest rates stalled the broadening in market participation, and leadership narrowed as investors rotated back into the large-cap growth companies, driving the Nasdaq Composite to record highs in late September.
Performance returns for the major equity indices were slightly positive, consolidating the first half’s near double-digit advance. The S&P 500 gained approximately 2% for the quarter and is up roughly 12% year-to-date (YTD), while the DJIA posted a quarterly decline of approximately -2.7%, bringing its return for the year to 6%. The technology heavy Nasdaq, the year’s strongest performer among the major indices, also rose 2% this quarter and is now up over 15% YTD. Sector leadership broadened during the quarter, with Energy, Technology, Industrials, and Health Care outperforming, while interest rate sensitive sectors such as Utilities, Real estate and Consumer Discretionary lagged.
S&P 500 earnings in the second quarter increased a remarkable 52.2%, with the third quarter’s estimates set to mark the third-straight quarter of earnings growth above 25%. Elevated growth expectations, combined with heavy concentration in the technology sector, raised the bar for corporate results and left the market more sensitive to any earnings disappointment. Notably, according to Factset, analysts now expect the other 493 S&P 500 companies to report higher earnings growth than the “Magnificent 7” companies in the fourth quarter of 2026.
International markets advanced in the third quarter, with the MSCI ACWI ex U.S. Index, which tracks global stock markets, gaining 14% YTD. The MSCI Emerging Markets Index, advanced 24% YTD, driven by AI-related demand and continued earnings growth. Strong market performance in India and Taiwan helped offset weakness in China, as well as headwinds from a stronger U.S. dollar and higher global interest rates.
_______________________________________________________________________________________________________________
 Bond Market & Interest Rates
September was the seventh straight monthly increase for the 10-year Treasury yield, which ended the quarter at 5.3% while the 30-year closed at a high of 5.6%. These levels reflected an increase in economic growth and investor concerns over persistent inflation, as elevated energy prices continued to push into broader prices, and additional government borrowing. Core PCE, the Fed’s preferred inflation gauge, rose 3% year-over-year in August resulting in The Federal Reserve raising the federal funds rate 25 basis points to 3.75%–4.00% in September, the first increase since 2023 with investors now expecting at least one additional hike before year end.
Mortgage Rates: Average 30-year mortgage rates hit 7.03%, the highest in three years, dragging down a housing market that is now in its fourth year of stagnant sales. According to the Bureau of
Labor Statistics, residential building permits fell 8.4% year-over-year and construction employment growth slowed to 0.6%, underscoring how elevated borrowing costs continue to weigh on housing
activity and broader economic momentum.
Performance returns in fixed income were impacted by the increase in rates in the third quarter, with the Bloomberg U.S. Aggregate Index down -3.51% for the quarter and -2.82% YTD. The Bloomberg
U.S. High Yield Index performed better at -1.73% last quarter and 0.19% YTD. Credit spreads, which measure the difference in yield between corporate and government bonds, started to widen as
investors required greater compensation for rising leverage, and for increased financing needs associated with AI investment.
_______________________________________________________________________________________________________________
 Economic Landscape
GDP: The U.S. economy grew in the second quarter of 2026, as the U.S. real Gross Domestic Product (GDP) increased by 2.2% annualized. Consumer spending remained strong and AI-related investment continued, helping to offset weaker government spending and slower investment activity. The Federal Reserve now projects full-year real GDP growth of approximately 2.3%, reflecting expectations for continued moderate expansion despite a more mixed economic backdrop.
Labor Market: The U.S. unemployment rate in August was 4.1%, consistent with a stable labor market. The number of jobs created and the increased labor force participation signal strength in hiring and workforce engagement. As inflation remains present, prices are rising faster than paychecks.
ISM Manufacturing: The ISM Manufacturing Index (PMI), which measures the direction and health of the manufacturing economy, expanded to 54 in August, marking an eighth consecutive month of growth. Manufacturing activity continued to be supported by solid production, expanding new orders, and growing employment, while input cost inflation stayed elevated, reflecting the pass-through of higher energy costs into manufacturing input costs.
__________________________________________________________________________________________________________
 Commodities
Oil: Tensions in the Middle East persisted and prices of oil and refined products remained high. Most notably, according to the U.S. Energy Information Administration, average U.S. diesel prices rose
approximately 30% in the quarter, from $5/gallon to over $6.50/gallon. As a critical input for freight, logistics and transportation, the higher diesel costs added significant pressure across supply chains.
Gold: The price of gold, $4,320, slipped during the quarter and remained relatively flat for the year, as investors continue to assess inflation risks. Demand was broadly supported by financial market
investment flows, growing industrial applications, as well as jewelry consumption.
Dollar: The U.S. Dollar Index (DXY) closed the quarter at 101.5, up roughly 3% for the year, holding its gains since the start of the Iran war. The dollar was supported by a hawkish policy stance, safe-haven demand, elevated inflation, and rising Treasury yields. Higher U.S. rates and a resilient economy continue to lift the dollar, though sustained strength presents a headwind for U.S. multinational profits.
September 2026
Economic & Market Summary Q3 2026.pdf